Every day you can read or hear someone talking about how volatility in the financial markets has taken off, or is just about to, and advising unsuspecting investors to buckle up for a bumpy ride. Volatility, which refers to how much a market rises and falls, is seen as one indicator of how risky a market is – the higher the volatility, the higher the risk. So just how volatile are markets these days compared with times gone by?
Morgan Housel of The Motley Fool wrote a great piece looking at this and the conclusions might surprise you. Here are the charts showing the daily, weekly, monthly and annual volatility of the S&P500 in the U.S. going back over each decade to the 1920s.
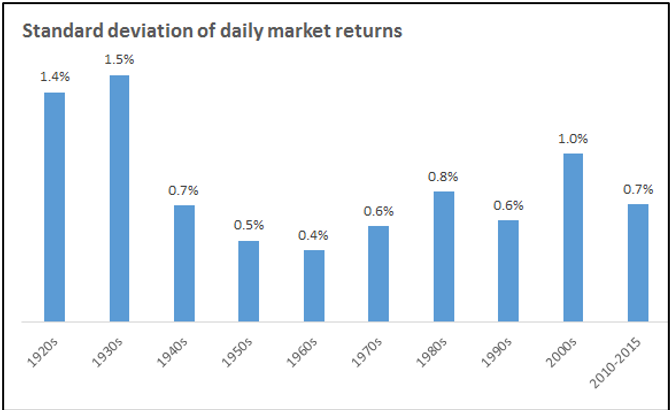
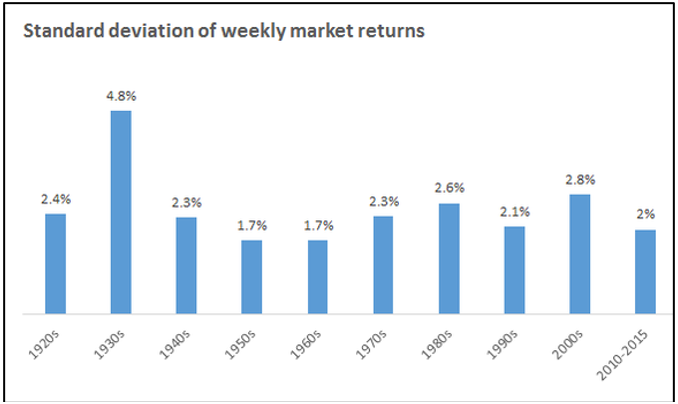
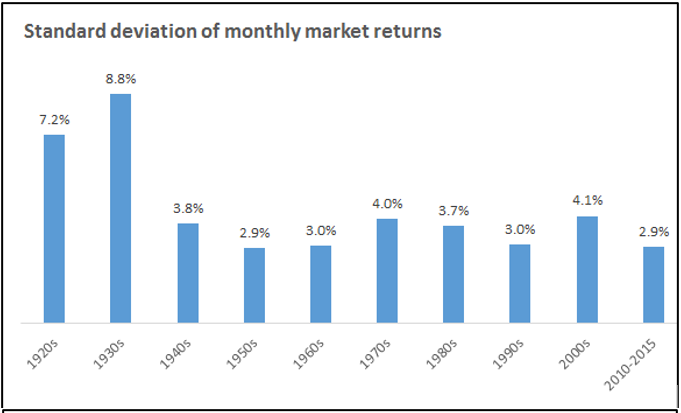
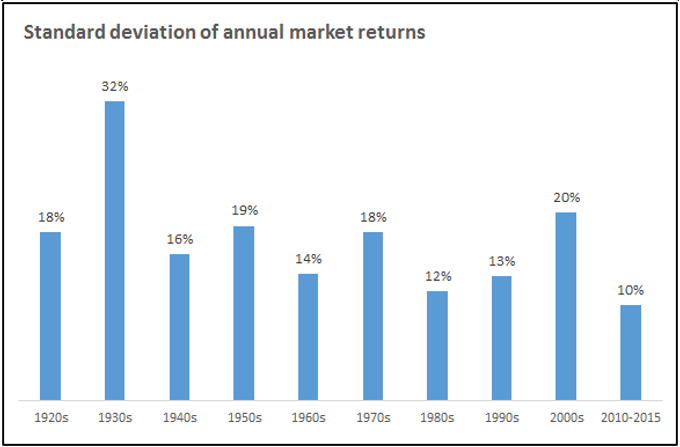
So what you may be surprised to find is that on all time periods, volatility over the past few years has been well below the average of close to the last 100 years:

Note the whopping difference of 33% and 42% respectively for the monthly and annual volatility.
There was also a terrific article by Ben Carlson recently looking at the volatility of GDP growth, again in the U.S. but it will be pretty indicative for many developed nations and very indicative in terms of financial market signals. We are constantly told the economy is in all kinds of danger and that the unprecedented monetary policy experiments will usher in economic Armageddon, and yet…
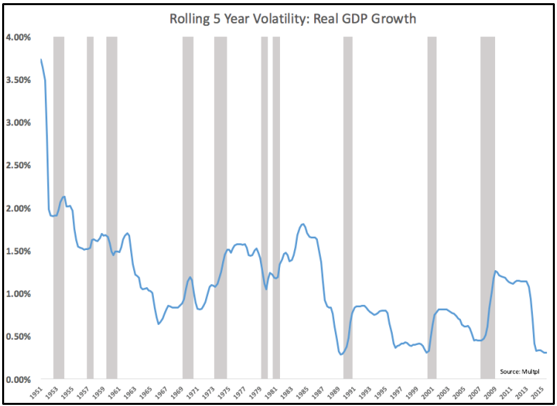
Once again, the volatility of GDP growth, even around the GFC, hasn’t been especially high, and over the last couple of years it’s been amongst the lowest on record.
There’s no end of commentators who connect volatility in the economy to volatility in financial markets, but as we’ve written before, and as the chart below shows, there is no correlation between the two.
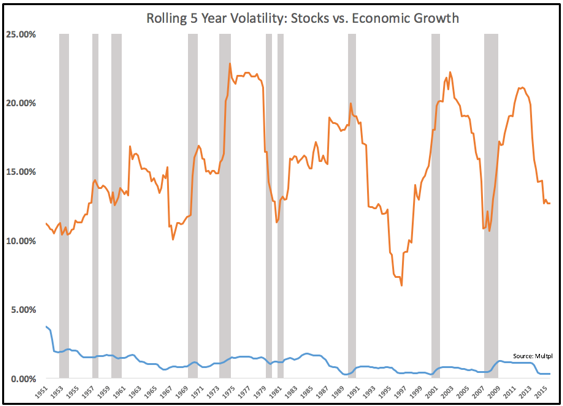
The takeaway is that when markets bounce around, which they always do every year without fail, it can feel like a scary ride at the time, and the incessant media noise can make it feel worse. It’s when you take a step back and look at the evidence that the real story comes out.

